

Power BI Performance analyzer
In Power BI è disponibile un utile tool Performance analyzer che torna utile per analizzare le query eseguite.
Nel risultato dell'analisi compare sia la query in formato DAX sia, nel caso di direct query, la query nel formato nativo della sorgente a cui è collegato.
Il tool si trova in View / Performance analyzer
Icona 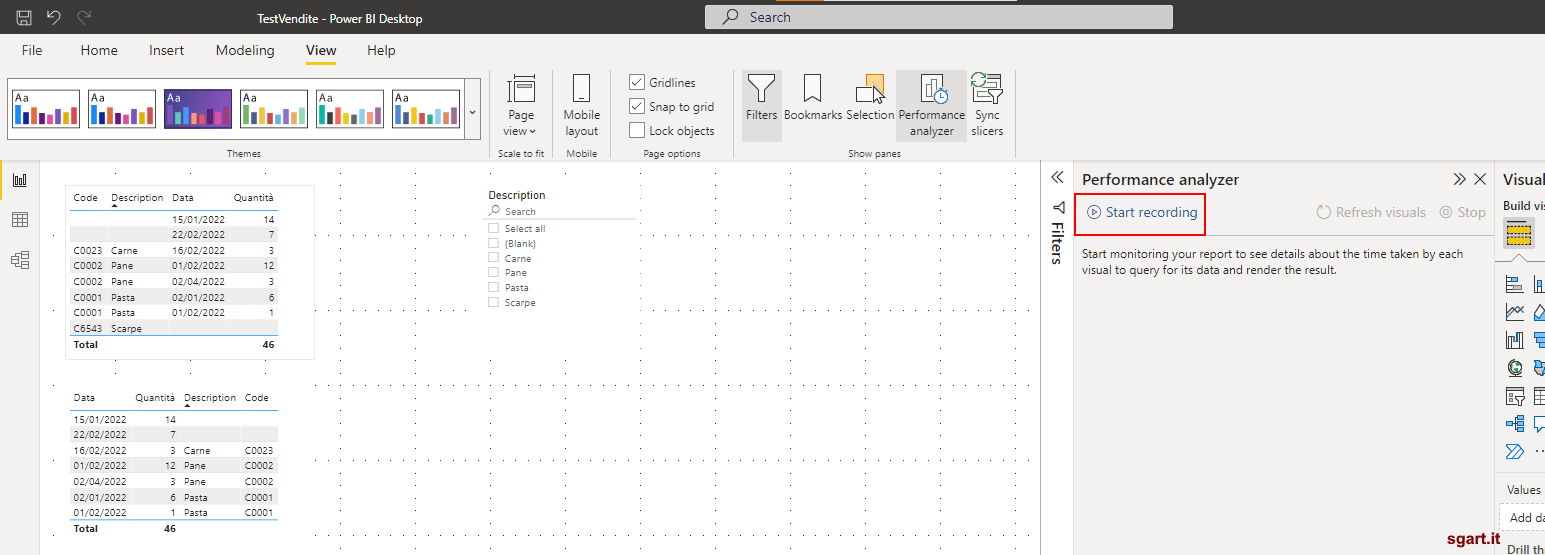
Pannello Performance analyzer
Una volta avviato su ogni visual compare un pulsante Analyze this visual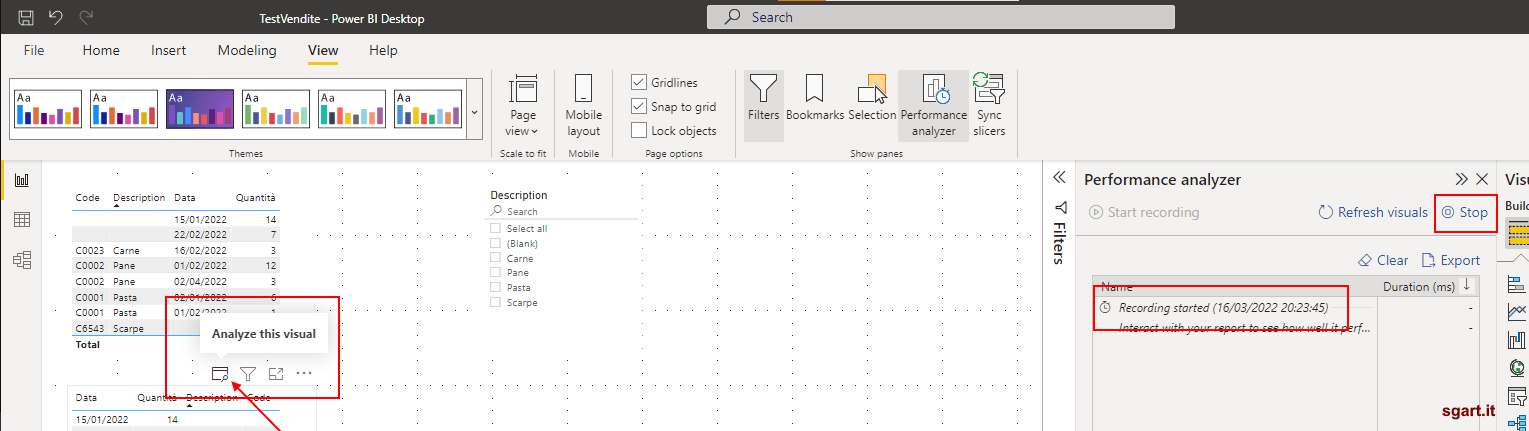
Starting 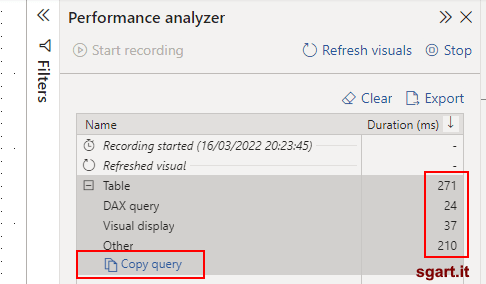
Recording
In questo caso, con una sorgente importata, la query DAX è questa:
Se faccio la stessa cosa sulla prima tabella con un ordine dei campi differente, ovviamente, ho una query DAX diversa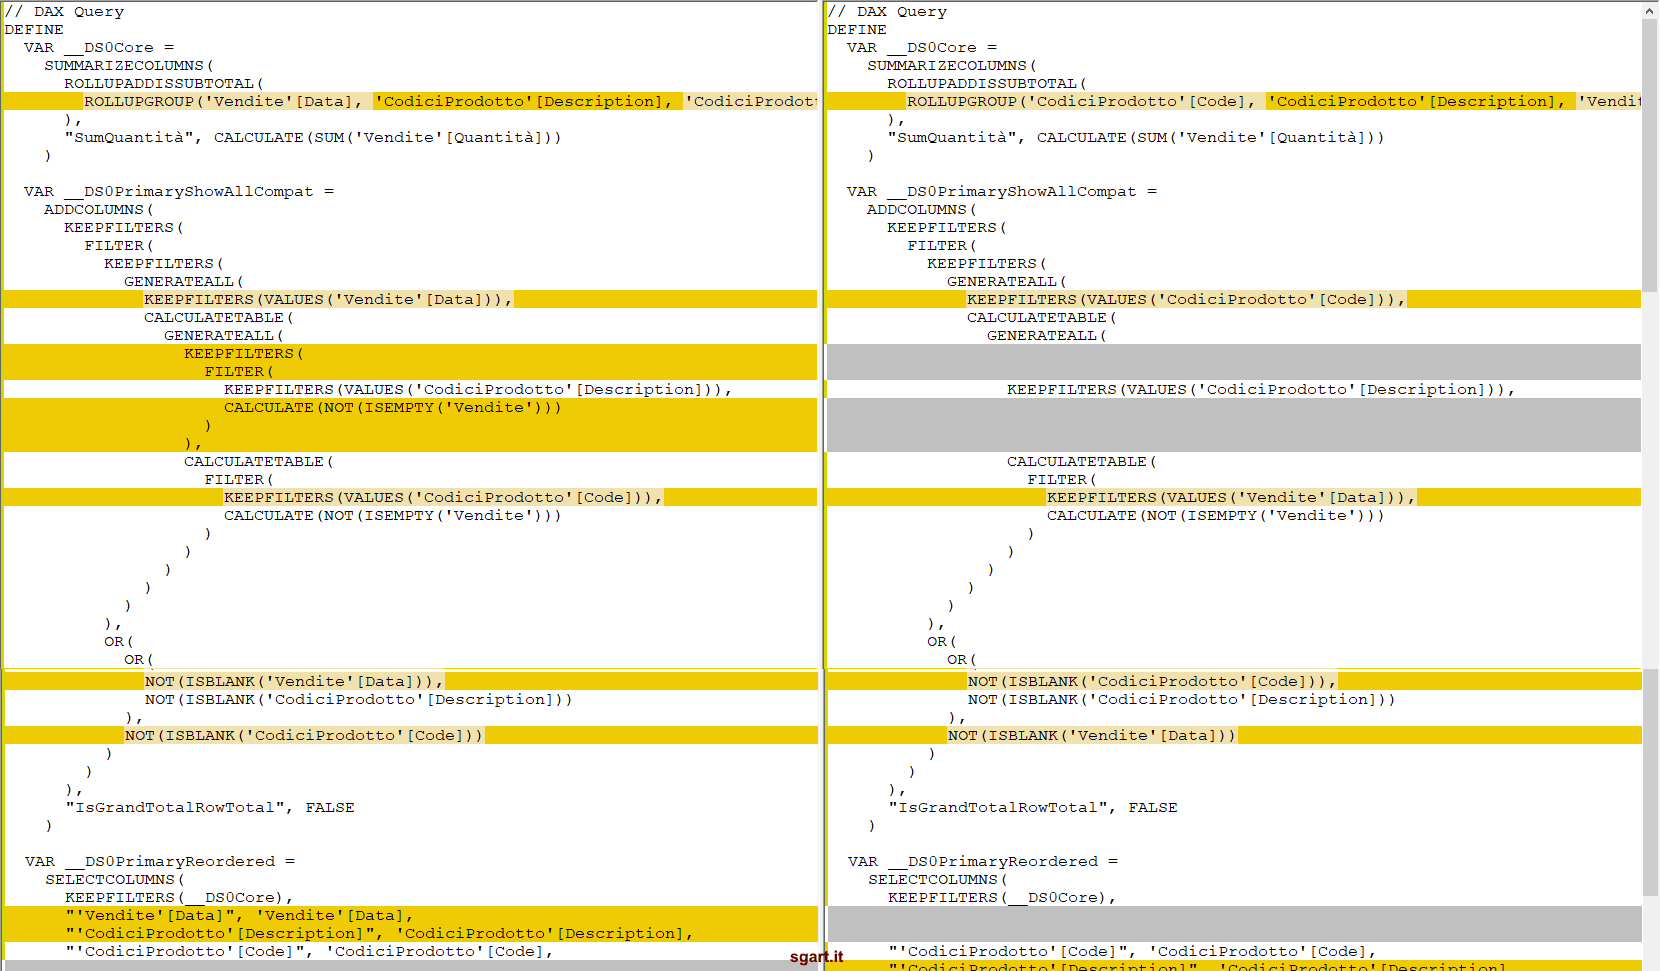
Confronto query DAX 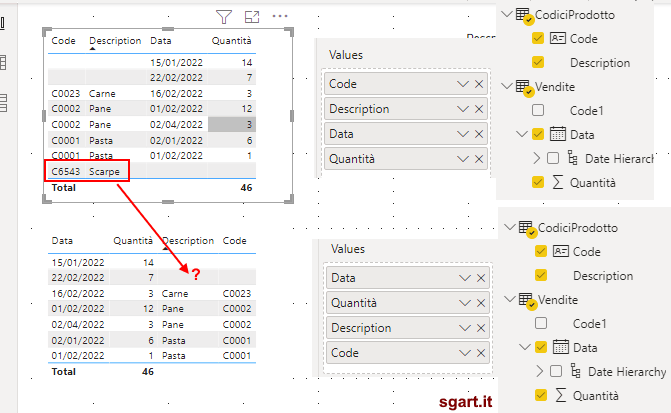
Dati diversi 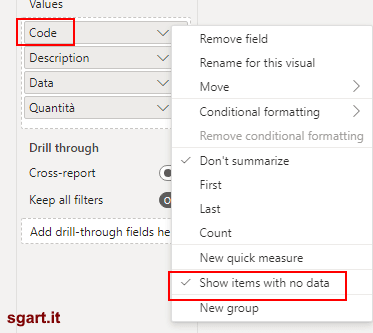
Show items with no data
Nel caso di una tabella SQL Server collegata in Direct Query la query DAX è simile a questa
Nel risultato dell'analisi compare sia la query in formato DAX sia, nel caso di direct query, la query nel formato nativo della sorgente a cui è collegato.
Il tool si trova in View / Performance analyzer
Una volta avviato su ogni visual compare un pulsante Analyze this visual
In questo caso, con una sorgente importata, la query DAX è questa:
// DAX Query
DEFINE
  VAR __DS0Core =
    SUMMARIZECOLUMNS(
      ROLLUPADDISSUBTOTAL(
        ROLLUPGROUP('Vendite'[Data], 'CodiciProdotto'[Description], 'CodiciProdotto'[Code]), "IsGrandTotalRowTotal"
      ),
      "SumQuantità", CALCULATE(SUM('Vendite'[Quantità]))
    )

  VAR __DS0PrimaryShowAllCompat =
    ADDCOLUMNS(
      KEEPFILTERS(
        FILTER(
          KEEPFILTERS(
            GENERATEALL(
              KEEPFILTERS(VALUES('Vendite'[Data])),
              CALCULATETABLE(
                GENERATEALL(
                  KEEPFILTERS(
                    FILTER(
                      KEEPFILTERS(VALUES('CodiciProdotto'[Description])),
                      CALCULATE(NOT(ISEMPTY('Vendite')))
                    )
                  ),
                  CALCULATETABLE(
                    FILTER(
                      KEEPFILTERS(VALUES('CodiciProdotto'[Code])),
                      CALCULATE(NOT(ISEMPTY('Vendite')))
                    )
                  )
                )
              )
            )
          ),
          OR(
            OR(
              NOT(ISBLANK('Vendite'[Data])),
              NOT(ISBLANK('CodiciProdotto'[Description]))
            ),
            NOT(ISBLANK('CodiciProdotto'[Code]))
          )
        )
      ),
      "IsGrandTotalRowTotal", FALSE
    )

  VAR __DS0PrimaryReordered =
    SELECTCOLUMNS(
      KEEPFILTERS(__DS0Core),
      "'Vendite'[Data]", 'Vendite'[Data],
      "'CodiciProdotto'[Description]", 'CodiciProdotto'[Description],
      "'CodiciProdotto'[Code]", 'CodiciProdotto'[Code],
      "IsGrandTotalRowTotal", [IsGrandTotalRowTotal]
    )

  VAR __DS0PrimaryShowAll =
    NATURALLEFTOUTERJOIN(
      SUMMARIZE(
        UNION(__DS0PrimaryReordered, __DS0PrimaryShowAllCompat),
        'Vendite'[Data],
        'CodiciProdotto'[Description],
        'CodiciProdotto'[Code],
        [IsGrandTotalRowTotal]
      ),
      __DS0Core
    )

  VAR __DS0PrimaryWindowed =
    TOPN(
      502,
      __DS0PrimaryShowAll,
      [IsGrandTotalRowTotal],
      0,
      'CodiciProdotto'[Description],
      1,
      'Vendite'[Data],
      1,
      'CodiciProdotto'[Code],
      1
    )

EVALUATE
  __DS0PrimaryWindowed

ORDER BY
  [IsGrandTotalRowTotal] DESC,
  'CodiciProdotto'[Description],
  'Vendite'[Data],
  'CodiciProdotto'[Code]
Se faccio la stessa cosa sulla prima tabella con un ordine dei campi differente, ovviamente, ho una query DAX diversa
Nel caso di una tabella SQL Server collegata in Direct Query la query DAX è simile a questa
// DAX Query
DEFINE
  VAR __DS0Core =
    SUMMARIZE('categories', 'categories'[Category], 'categories'[ID])

  VAR __DS0PrimaryWindowed =
    TOPN(501, __DS0Core, 'categories'[Category], 1, 'categories'[ID], 1)

EVALUATE
  __DS0PrimaryWindowed

ORDER BY
  'categories'[Category], 'categories'[ID]


// Direct Query

SELECT
TOP (501) [t4].[ID],[t4].[Category]
FROM
(
(
select [$Table].[ID] as [ID],
    [$Table].[Category] as [Category],
    [$Table].[modified] as [modified]
from [dbo].[categories] as [$Table]
)
)
 AS [t4]
GROUP BY [t4].[ID],[t4].[Category]
ORDER BY [t4].[Category]
ASC
,[t4].[ID]
ASC